Measuring and quantifying jitter are the first steps toward controlling it.
Jitter is a measure of the timing performance of a digital data stream such as Ethernet, USB, PCIe, or HDMI. It defines when data transitions occur in relation to an ideal waveform. Excess jitter can lead to signal-integrity problems that result in high bit-error rates and poor communications-channel performance. Observing jitter and assigning numbers to it are the first steps in limiting it to acceptable levels.
What instrument do I use to measure jitter?
Jitter is basically a time-domain phenomenon, and the oscilloscope is typically the go-to tool for jitter measurements. Note, though, that jitter is related to phase noise, and you can use a frequency-domain instrument such as a spectrum analyzer or phase-noise analyzer to measure some aspects of jitter such as its component frequencies, but not all. Frequency-domain instruments cannot, say, directly measure timing differences between successive cycles.
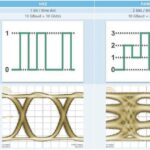
You can, however, make those measurements in the time domain. If you look at a serial data stream using an oscilloscope, you will see the familiar eye diagram (Figure 1), where each eye makes up one unit interval (UI). An eye diagram is made up of successive bits overlayed on top of one another. That lets you see the time and amplitude differences among bits. Amplitude does affect jitter. A signal with a smaller amplitude will make its transition from high to low (or low to high) faster than a signal of greater amplitude.

What can I learn about jitter from this display?
You cannot learn too much from this single snapshot. We can, though, see that successive transitions deviate from the ideal, so we know jitter is present. We can estimate the peak-to-peak jitter, as indicated by the arrows. If the horizontal time-base is set to 20 ps/div, then the peak-to-peak jitter appears to be about 10 ps.
How can we learn more about jitter?
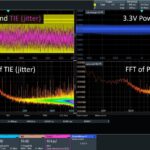
Makers of high-end oscilloscopes provide jitter-measurement tools for their instruments. For example, Keysight provides D9020JITA jitter and phase-noise analysis software; Rohde & Schwarz offers its RTP-K12 jitter-measurement software; Tektronix provides its DPOJET eye-diagram, jitter, noise, and timing-analysis package; and Teledyne LeCroy offers its SDAIII-CompleteLinQ jitter and eye-diagram analysis tools. These tools can derive a lot of information about jitter that’s not immediately observable from one oscilloscope display.
How do those tools work?
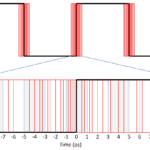
Let me provide a simple manual example of what these tools can do automatically. Consider the top waveform in Figure 2, where the black square wave represents the ideal transition time. You can see that each red rising and falling edge deviates from the ideal transition time. This deviation, a component of jitter, is called the time interval error (TIE). Let’s zoom in on the rising edge (Figure 2, bottom). The earliest transition occurs 7.5 ps before the ideal transition time, and the latest occurs 7.5 ps after, so our measurement shows that peak-to-peak jitter is 15 ps.

Is peak-to-peak jitter the banner spec for jitter?
It’s just one measure of jitter. If you look closely at Figure 2, you will see 28 edges, and only two of them contribute to peak-to-peak jitter. There might well be useful information in the others. The first step in extracting this information is to compile the 28 data points for each transition into a table (Table 1).
Table 1. Transition timing
| Transition | Time (ps) |
| #1 | -7.5 |
| #2 | -6.5 |
| #3 | -6 |
| … | … |
| #26 | 5.75 |
| #27 | 6.25 |
| #28 | 7.5 |
In part 2 of this two-part series, I’ll show what types of information can be extracted from this set of 28 data points. Keep in mind, though, that the automated tools from the oscilloscope makers process thousands or tens of thousands of data points at a time, not just a couple of dozen. Also in part 2, I’ll discuss the jitter hierarchy, including total jitter (Tj), random jitter (Rj), deterministic jitter (Dj), data-dependent jitter (DDj), and periodic (or sinusoidal) jitter (Pj). Finally, I will suggest what you can and cannot do to alleviate jitter problems.
Where can I learn more right now?
Keysight has an application note on jitter fundamentals, and Tektronix has a primer on characterizing jitter. Rohde & Schwarz has a white paper on how to debug jitter problems, while a white paper from Teledyne LeCroy explains how the company’s jitter tools perform calculations. Skyworks has a jitter dictionary with measurement tips. Finally, EEWorld has articles on eye diagrams and on using an oscilloscope to measure jitter.
Continue to Part 2.


Leave a Reply
You must be logged in to post a comment.