Operations on acquired jitter data help quantify jitter values.
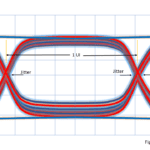
Part 1 of this article described the oscilloscope eye diagram and unit interval (UI) and focused on a single ideal rising edge with 28 additional edges representing some degree of jitter (Figure 1). We determined the peak-to-peak jitter to be 15 ps, based on the edges occurring at -7.5 and +7.5 ps. We can derive other jitter values as well.

What’s an example?
RMS jitter (JRMS) is one, as shown in Table 1, which lists times tn for all 28 edges in Figure 1 relative to the ideal transition time. (Jitter tools compile tables like this for post-processing, although they acquire tens of thousands of data points instead of just a couple dozen.) We can calculate JRMS as follows:

Table 1 shows this calculation carried out manually, showing each value for tn, tn2, the sum of the squares, the mean of the sum of the squares, and the square root of the mean of the sum of the squares.
| n | Bin | tn (psec) | tn² (psec²) |
| 1 | 1 | -7.5 | 56.25 |
| 2 | 2 | -6.5 | 42.25 |
| 3 | 2 | -6 | 36.00 |
| 4 | 3 | -4.5 | 20.25 |
| 5 | 3 | -6 | 16.00 |
| 6 | 3 | -3.5 | 12.25 |
| 7 | 3 | -3.25 | 10.56 |
| 8 | 4 | -2.75 | 7.56 |
| 9 | 4 | -2.5 | 6.25 |
| 10 | 4 | -2 | 4.00 |
| 11 | 4 | -1.5 | 2.25 |
| 12 | 4 | -1.25 | 1.56 |
| 13 | 5 | -0.8 | 0.64 |
| 14 | 5 | -0.6 | 0.36 |
| 15 | 5 | -0.4 | 0.16 |
| 16 | 5 | -0.2 | 0.04 |
| 17 | 5 | 0.5 | 0.25 |
| 18 | 5 | 0.75 | 0.56 |
| 19 | 6 | 1.25 | 1.56 |
| 20 | 6 | 1.5 | 2.25 |
| 21 | 6 | 2 | 4.00 |
| 22 | 6 | 2.5 | 6.25 |
| 23 | 7 | 3.25 | 10.56 |
| 24 | 7 | 4 | 16.00 |
| 25 | 7 | 5.75 | 33.06 |
| 26 | 8 | 5.75 | 33.06 |
| 27 | 8 | 6.25 | 39.06 |
| 28 | 8 | 7.5 | 56.25 |
| Sum of squares | 406.45 | ||
| Mean: | 14.52 | ||
| JRMS (psec) | 3.81 |
Table 1. Data for calculating RMS jitter.
What are the “Bin” values in the table?
Once we collect the jitter data, we can do all kinds of post processing, including statistical analysis, and jitter is often represented in histogram form. Figure 2 shows a histogram based on the example from Table 1.

What can I do about jitter?
That depends on what kind you have. At the top of the jitter hierarchy is total jitter (Tj), which includes random (Rj) and deterministic jitter (Dj). You can’t do much about Rj, which is unbounded — the tails at either end of its Gaussian distribution never go to zero. If you display an eye diagram of a serial data stream, set your scope to maximum persistence, and wait long enough, the eye will eventually close because of Rj transitions occurring throughout the UI. To minimize Rj, follow best practices for signal integrity — you might start with one of Eric Bogatin’s books on the topic.On the other hand, deterministic jitter includes data-dependent jitter (DDj) and periodic jitter (Pj). DDj can result from rise times differing from fall times or from inter-symbol interference (ISI), in which energy from one bit spills over into the next bit. You might need to redesign your transceiver to adjust rise and fall times or fine-tune your filtering to minimize ISI to address DDj issues. Pj, also called sinusoidal jitter, can result from interference from a power supply’s switching frequency, which you might address with better filtering or shielding.
How do I know if I have too much jitter?
A better question is whether your bit error ratio (BER) is sufficiently low.
Is bit error ratio the same as bit error rate?
Although often used interchangeably, they are different. If I transmit 28 bits and get two errors, my BER is 2/28 = 0.0714, a unitless number. If my bit rate is 100 b/s, then my bit error rate is 7.14 errors per second. Adding to the confusion, the instrument used to directly measure these parameters is called either a bit-error-ratio tester or a bit-error-rate tester (both abbreviated BERT), depending on the manufacturer (see, for example, Anritsu, Keysight Technologies, Tektronix, and Teledyne LeCroy).
What is an acceptable BER?
That depends on your application and the standard you must meet. For PCI Express, it’s 10-12, or one error per terabit transmitted. Standards-compliance tests generally require the use of a BERT to verify that the target BER is met.

Should I just use a BERT instead of oscilloscope?
BERTs are expensive and time-consuming to use and may not provide insight into why errors occur. An understanding of how BERT results relate to oscilloscope eye diagrams, however, can help you effectively use both. Figure 3 shows an oscilloscope eye diagram positioned above what’s often called a bathtub curve, which plots BERT-derived BER measurements (blue curves). Its horizontal axis represents the relative time within the UI at which BER measurements occur, with 0 and 1 representing the ideal leading and trailing transitions of the UI, respectively. The BER approaches 1 near the beginning and end of the UI but drops near the center. In the Figure 3 example, BER falls below the 10-12 PCIe target between 0.3 and 0.7, as denoted by the red arrow. Projecting vertically upwards from the ends of the arrow into the eye diagram (vertical red lines) enables us to define a region (red polygon) where we can expect the bit error ratio to be 10-12 or less.
How do I use this polygon during my design?
If during your design and pre-compliance tests you observe transitions within this polygon, you still have work to do. If the polygon is free of transitions, you can have some confidence (but no guarantee) that your design will pass compliance test.


Leave a Reply
You must be logged in to post a comment.