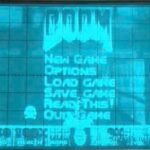
Spend enough time on YouTube and you’ll uncover numerous videos showing some kind of video game being played on an oscilloscope. The most popular game choices for these videos seem to be the old Doom and Quake games and Pong, the first real video game released in 1972. Perhaps the main reason for Doom’s popularity […]
FAQ
The case for buying a used oscilloscope
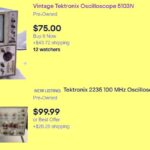
Not all test labs need oscilloscopes sporting 1 GHz bandwidths and multi-million-point digital waveform recording. When the needs lean more toward the basic side, used scopes can sometimes fit the bill and do so economically. Here are a few points to consider before ponying up for a used scope. The go-to website for used equipment […]
Putting the spotlight on infrared sensor technology
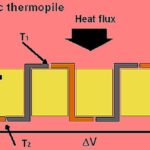
William Herschel was a gifted musician and composer who by chance obtained a 10-foot long, 30-inch reflecting telescope from the estate of his deceased friend, a violinist. Due to damage in moving it, he had to rebuild the instrument. This drew him into telescope making and then astronomy. He also discovered infrared radiation by placing […]
Why you don’t need a variable-speed drive to change a fan’s speed

To engineers schooled in modern motor control methods, it may be hard to grasp why three-speed fans designed to move air around in a room can be inexpensive. After all, these fans are powered by as motors, and the go-to method for changing the speed of industrial ac motors is via variable-frequency drives. VFDs work […]
What’s a ring tester and why do you need one?
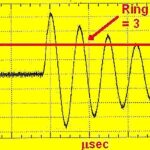
If you one day find yourself with a transformer that might or might not have a shorted winding, your first inclination for verifying your suspicions might be to find an inductance meter. The problem with powering up an inductance meter for this situation is that the inductance of a transformer containing a shorted turn might […]
Making better oscilloscope measurements through horizontal and vertical scaling
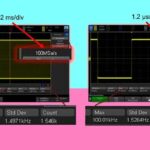
Early oscilloscope models were primitive by modern standards. Among the first major innovations was triggered sweep, introduced by Tektronix just in time for the post-World War Two electronics boom. This improvement in waveform imaging synchronized successive periodic waveforms to create a coherent image, based on a uniform level along the rising edge or another user-defined […]
Traceability and the hierarchy of calibration
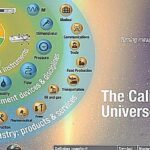
Advances in the science of measurement are simplifying the task of accurately quantifying uncertainty. Michael Brown, Fluke Calibration Accurate measurements are critical to every aspect of our lives; that’s why metrology is the oldest science in the world. Our ability to understand the world around us depends on how well we can measure it. As […]
What are the telegrapher’s equations?
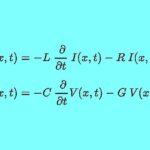
You can thank Oliver Heaviside (actually a short, thin man), for the telegrapher’s equations (or just telegraph equations). These are probably better known as the transmission line equations. They are actually a pair of coupled, linear partial differential equations that describe the voltage and current on an electrical transmission line with distance and time. RF […]
Can you tell the difference between an electrolytic and super capacitor?

If you disassemble an electrolytic capacitor and a supercapacitor, you might have trouble distinguishing differences between the two unless you had a practiced eye. Physically, the two can resemble each other though their electrical performance differs drastically. First a few basics. Ordinary capacitors, of course, are characterized by metal plates separated by a dielectric. In […]
What to look for during instrument calibration
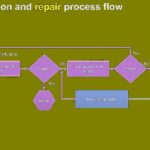
When you send an instrument to a calibration lab, what do you expect to happen? The comprehensive definition of calibration is a verification of instrument specifications by measuring actual performance using external lab standards, normally instruments, which have better performance than the thing they’re measuring and which are traceable to the International System of Units […]
